-
Visualization of COVID19 Cases in Jersey City, NJ
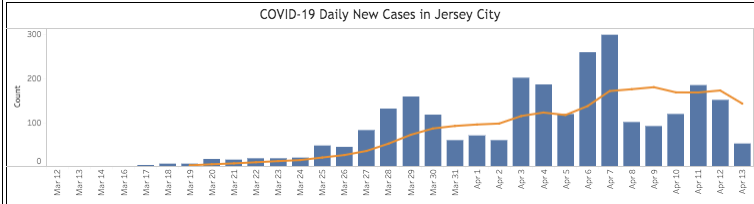
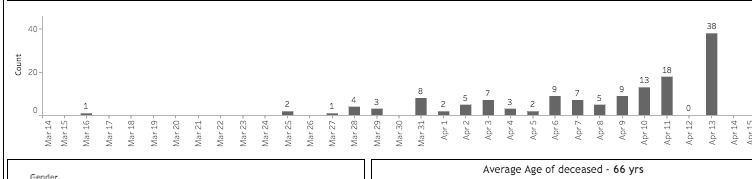
As of April 13, the rate of new cases is decreasing in Jersey City, NJ, while the rate of new deaths is seeing a spike (38 cases on 4/13). This follows a common pattern, with a peak in fatalities delayed, following a peak in the growth rate of new cases. It looks like JC peaked on April 7 with 299 new cases, so we should start to see fatalities start to go down soon, too. The curve is flattening, but we have a ways to go before the growth rate comes down (at least another 2-3 weeks of social distancing, would be my guess). Increased availability of testing has helped identify cases, but there are still probably 1/4 of cases not being detected (either due to asymptomatic cases or mild cases that go unreported), which would mean that the 2674 cases currently counted in Jersey City is probably actually closer to 3300. This means JC has more total cases than some states (e.g., The entire state of Mississippi has 3087 cases, as of 4/14/20).
April 14, 2020 / ZLK / Comments Off on Visualization of COVID19 Cases in Jersey City, NJ
Data Visualization: NPR Predictions for Corona Virus Peak – By State New York Times Visualization of When Each U.S. State is Re-opening w/ Current Rates of Infection
Comments are currently closed.