Zack Lischer-Katz, PhD / Visual Information

 
  • Home
  • CV/Bio
  • Research
    • Presentations
    • Publications
  • Teaching
  • Media
    • Curation
    • Film Photography
    • Film/Video
    • Sound
Menu
  • Home
  • CV/Bio
  • Research
    • Presentations
    • Publications
  • Teaching
  • Media
    • Curation
    • Film Photography
    • Film/Video
    • Sound
  • New York Times Visualization of When Each U.S. State is Re-opening w/ Current Rates of Infection


    Map of U.S. States showing COVID-19 Restrictions / Openings
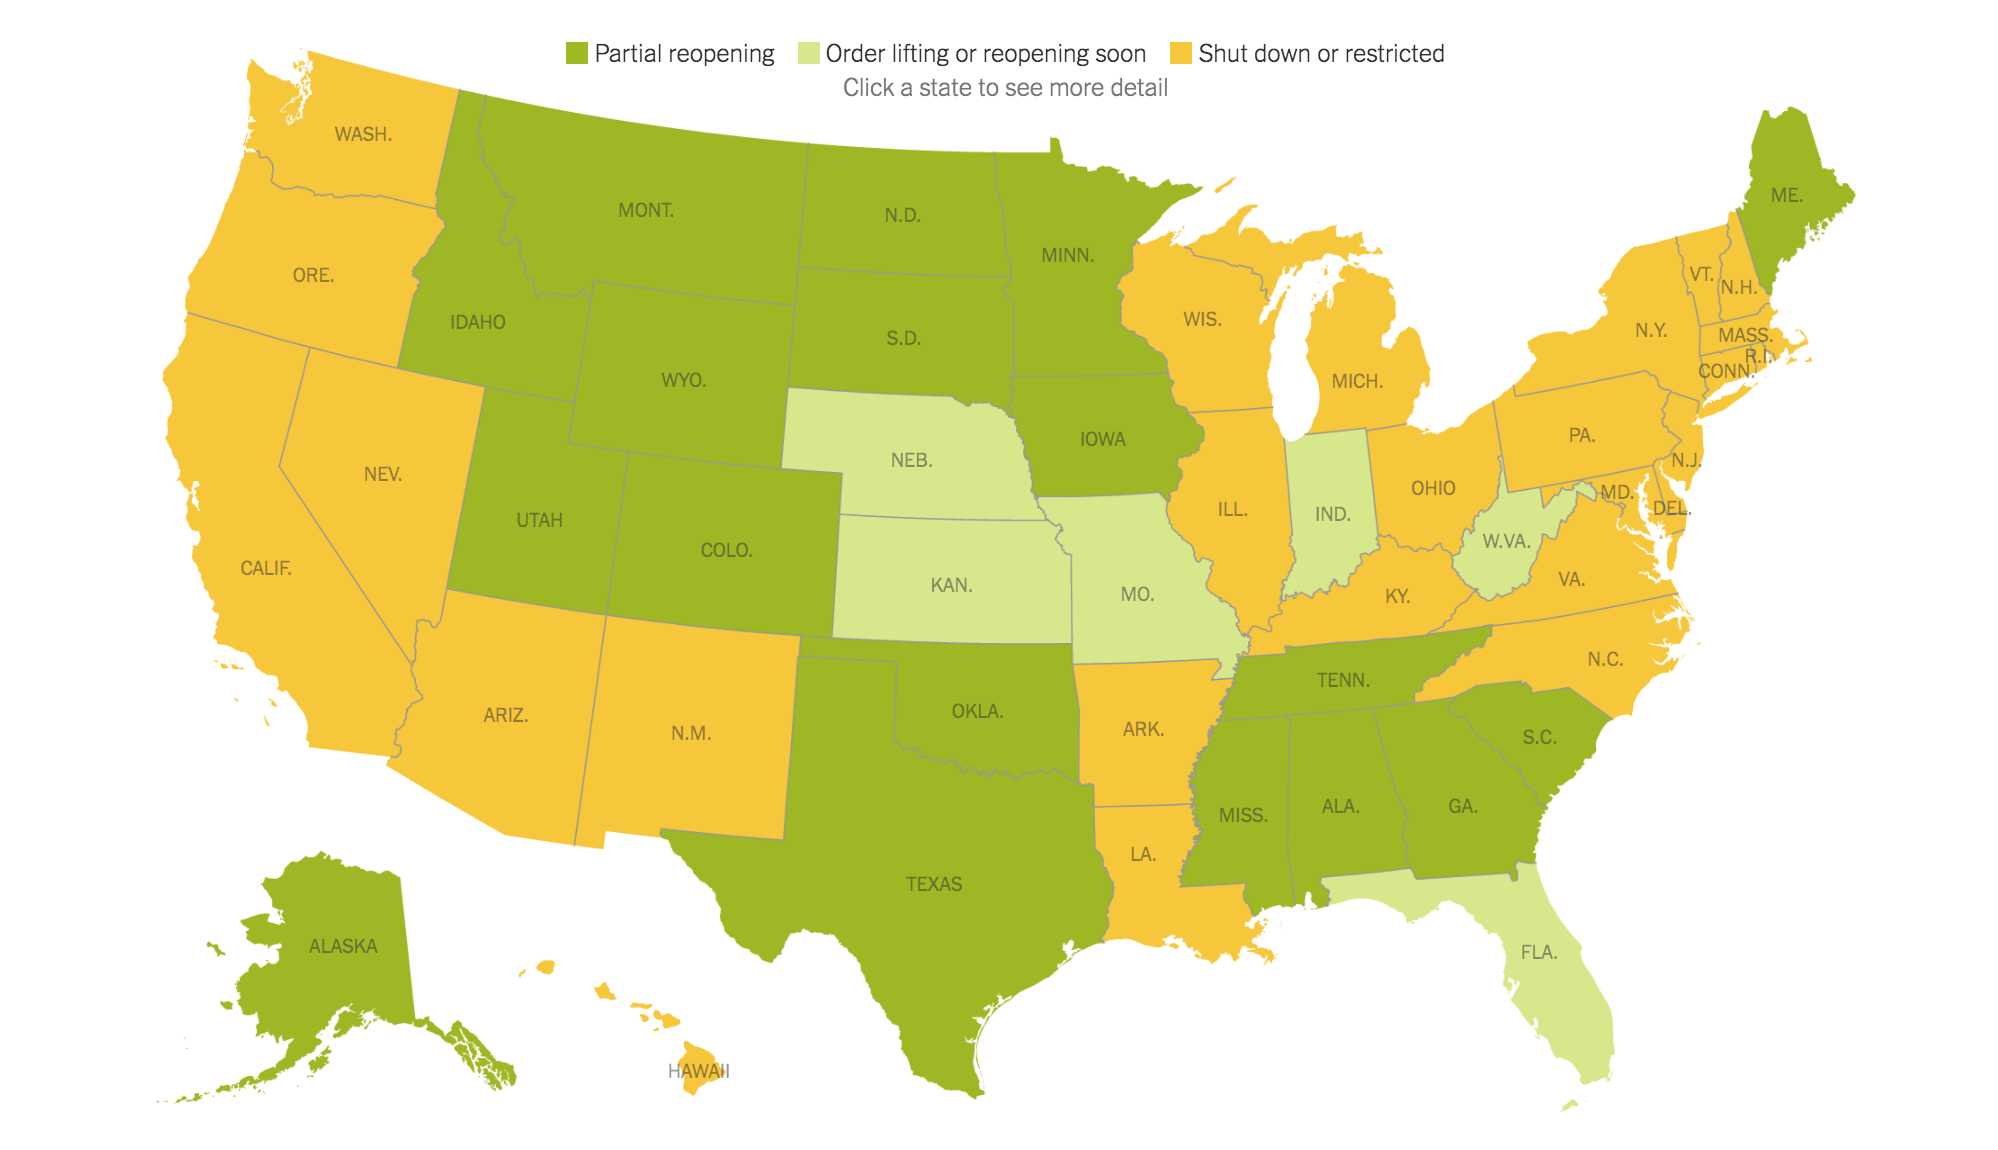
New York Times Visualization Showing If/When Each U.S.State is Re-opening, along w/ Current Rates of Infection

    https://www.nytimes.com/interactive/2020/us/states-reopen-map-coronavirus.html

    May 3, 2020 / ZLK / Comments Off

    Categories: Data Visualization

    Visualization of COVID19 Cases in Jersey City, NJ New Publication in the Journal of Interactive Technology & Pedagogy, “Barriers to Supporting Accessible VR in Academic Libraries”

    Comments are currently closed.

Latest tweets

  • Loading tweets...

Follow @Zack Lischer-Katz


Recent Posts

  • Chapter published: “Virtual Reality and the Academic Library of the Future” – American Philosophical Society
  • New Journal Article in Journal of Documentation (2022): The emergence of digital reformatting in the history of preservation knowledge: 1823- 2015.
  • Article Published in College & Undergraduate Libraries (2021): “Practical steps for an effective virtual reality course integration”
  • New Publication in Preservation, Digital Technology, & Culture “Using 3D/VR for research and cultural heritage preservation”
  • New Publication in C&RL Journal: “3D Data Repository Features, Best Practices, and Implications for Preservation Models: Findings from a National Forum”
  • New Publication in Records Management Journal, “Archiving experience: An exploration of the challenges of preserving virtual reality.”
  • New Publication in the Journal of Interactive Technology & Pedagogy, “Barriers to Supporting Accessible VR in Academic Libraries”
  • New York Times Visualization of When Each U.S. State is Re-opening w/ Current Rates of Infection
  • Visualization of COVID19 Cases in Jersey City, NJ
  • Data Visualization: NPR Predictions for Corona Virus Peak – By State

All human knowledge takes the form of interpretation.

-Walter Benjamin

Contact

You can contact Zack Lischer-Katz by emailing him at zlkatz@email.arizona.edu

Latest tweets

  • Loading tweets...

Follow @Zack Lischer-Katz

Copyright © 2020 Zack Lischer-KatzTheme created by PWT. Powered by WordPress.org